A few years back, I bought a cheap (~$20) rtl-sdr software-defined radio dongle. This contains a Realtek RTL2832U demodulator chip, typically paired with a Rafael Micro R820T tuner, for a frequency range of 24 - 1766 MHz at a maximum bandwidth of 3.2 MHz. Unfortunately, this bandwidth is quite a narrow slice of spectrum, and makes it difficult to find interesting signals to analyze. One workaround is to perform fast frequency hopping, and stitch together the output to create a wideband frequency survey. The librtlsdr software suite includes a tool to do this, called rtl_power.
The output from this tool can be difficult to visualize, so I developed d3-waterfall, an open-source web-based visualization using HTMl5 and d3.js. It supports automatic labeling of axes with frequency and time, configurable color schemes, and annotated signal tooltips using data from the Signal Identification Guide. Shown below is a screenshot of the waterfall display, captured over the 24 - 1766 MHz frequency range at 1 MHz intervals for 24 hrs, starting at 10 AM on October 8th, 2016, in Pittsburgh, PA.
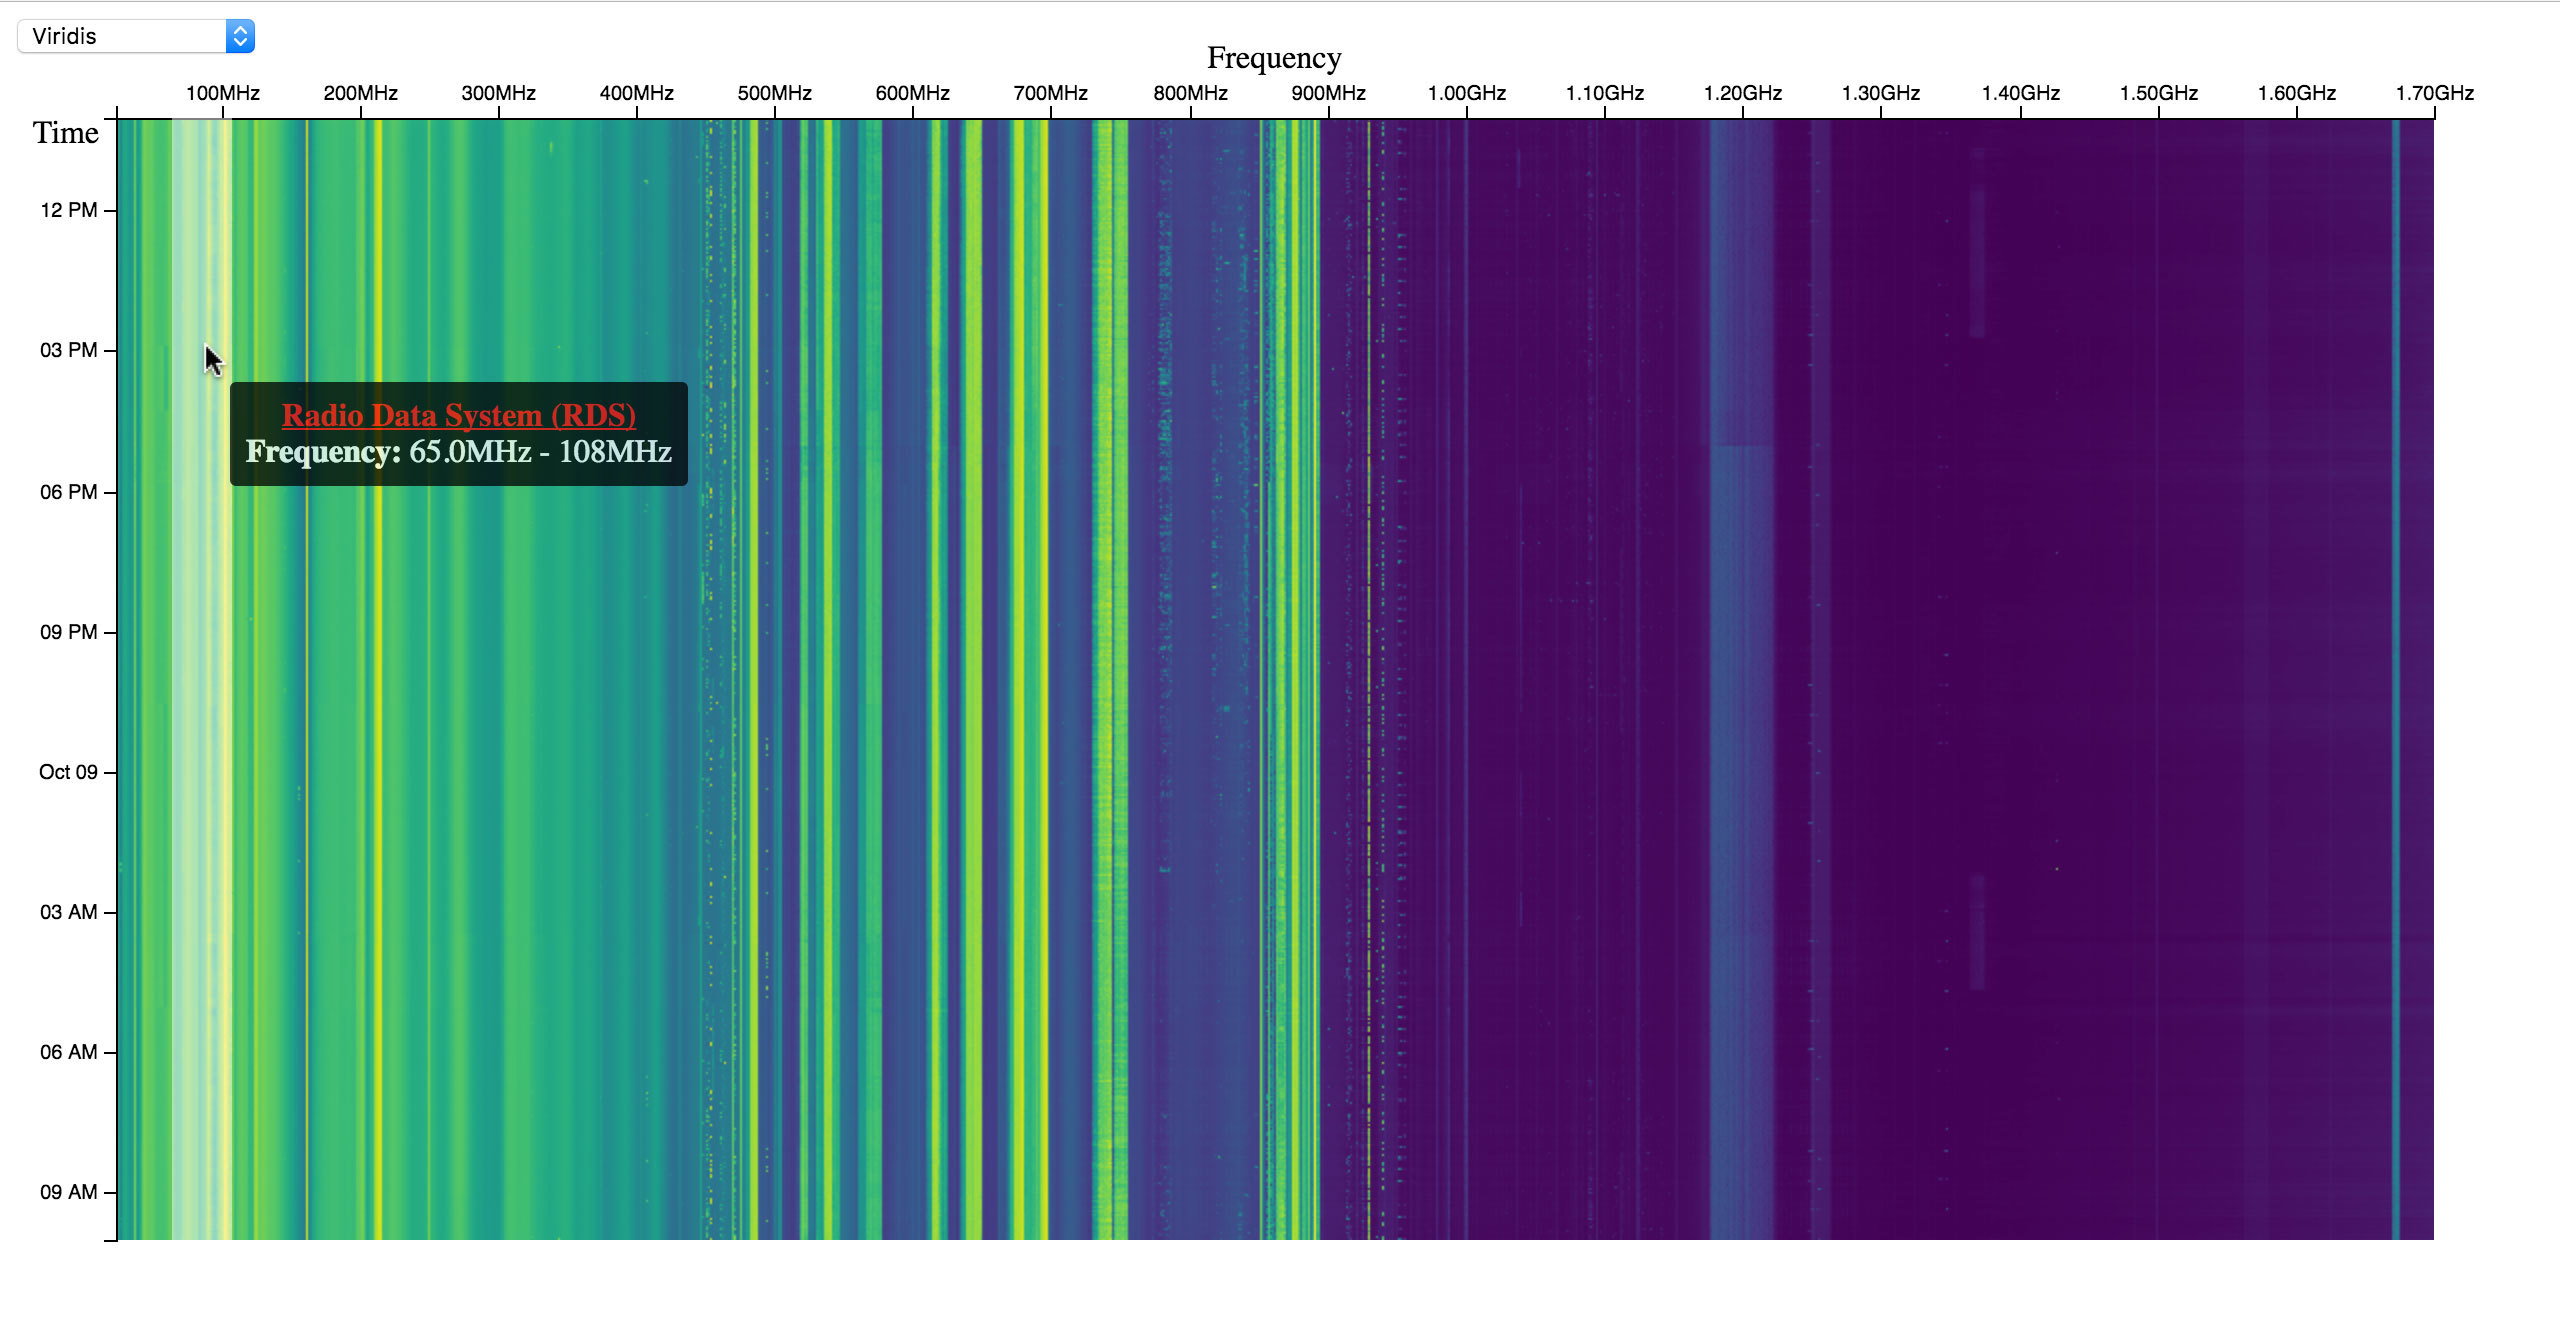
d3-waterfall interactive visualization; click to launch (slow, 65 MB data)
It can also be useful to cross-reference with the United States Frequency Allocation Chart (shown below), which lists all frequency allocations up to 300 GHz. Interesting signals include FM radio at 87.8 - 108 MHz, airplane tracking using ADS-B transponders at 1090 MHz and ACARS at 129 - 137 MHz, digital video (DVB-T) at 474 - 786 MHz, and portions of 2G cellular communications (GSM) at 450 - 1800 MHz, among many others. Happy hunting!
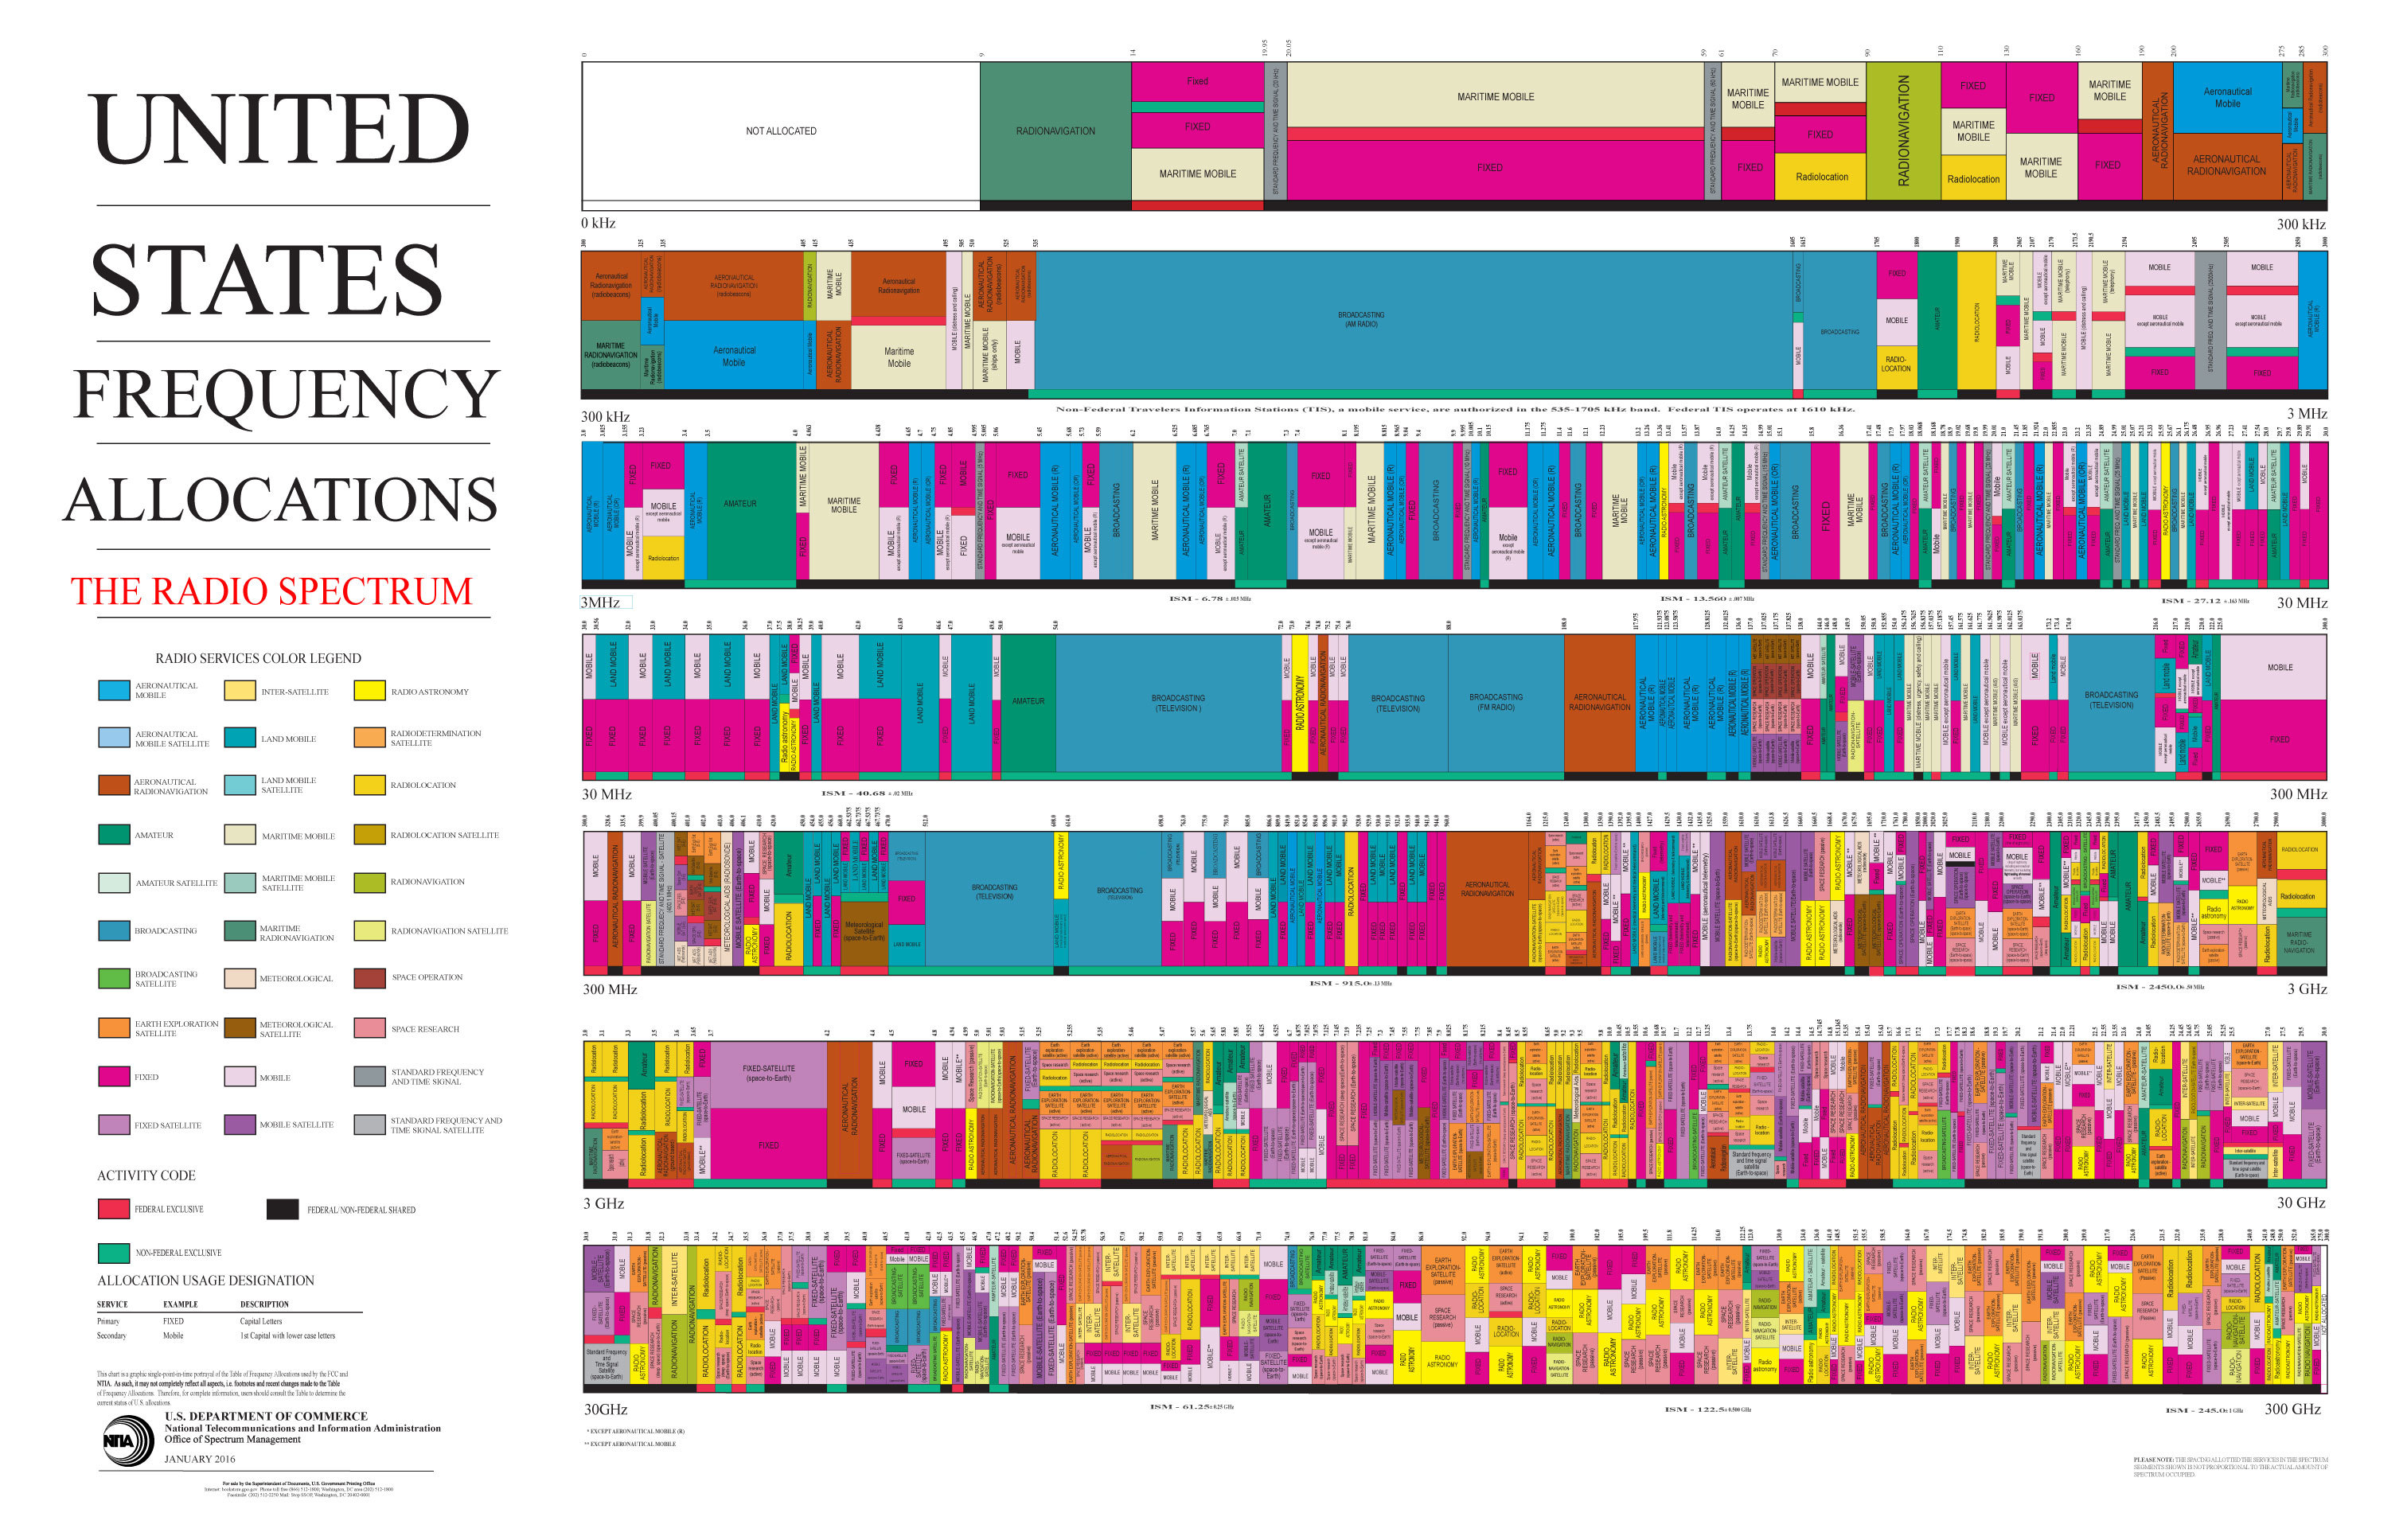
United States Frequency Allocation Chart, as of January 2016